
It is that time again; when the country starts to debate on one of the most important topics. Who should make it to the College Football Playoffs?
The College Football Playoff (CFP) is an annual postseason knockout tournament to determine a national champion of the NCAA Division I Football Bowl Subdivision (FBS), the highest level of college football competition in the United States. Till a few years ago, polls or computer rankings were used to select the participants for the Bowl Championship Series (BCS), the title system used in FBS from 1998 to 2013. That clearly made everybody’s blood pressure go up. So a new system was devised. A 13-member committee selects and seeds the four teams to take part in the CFP. The Four teams play in two semifinal games, and the winner of each semifinal advances to the College Football Playoff National Championship game. Yay! So much simpler and debate free. Lol! Of course none of it actually matters because this is not even an officially sanctioned championship event by the NCAA, the sport’s governing body. It is purely for keeping football crazy fans engaged for a few more weeks and making a gazillion more dollars.
From my bio, you know I like to mix art and science and the CFP is clearly a great candidate for mixing the two. So here is my logical attempt.
To get you all to read the rest of my article (or not if you agree completely) here are my results.
| Rank | Team | Conference | Points | Win | Loss |
| 1 | Alabama | SEC | 124.001 | 13 | 0 |
| 2 | Oklahoma | Big 12 | 117.316 | 12 | 1 |
| 3 | Clemson | ACC | 113.869 | 13 | 0 |
| 4 | Notre Dame | Independent | 111.044 | 12 | 0 |
| 5 | Ohio State | Big Ten | 110.629 | 12 | 1 |
| 6 | Central Florida | American | 107.280 | 14 | 0 |
| 7 | Georgia | SEC | 105.450 | 11 | 2 |
| 8 | Michigan | Big Ten | 102.100 | 10 | 2 |
| 9 | Fresno State | MWC | 100.570 | 11 | 2 |
| 10 | Washington | Pac 12 | 98.550 | 12 | 3 |
| 11 | Louisiana State | SEC | 97.050 | 9 | 3 |
| 12 | Washington State | Pac 12 | 95.050 | 10 | 2 |
| 13 | Utah State | MWC | 94.600 | 10 | 2 |
| 14 | Florida | SEC | 93.450 | 9 | 3 |
| 15 | West Virginia | Big 12 | 92.600 | 8 | 3 |
| 16 | Kentucky | SEC | 92.550 | 9 | 3 |
| 17 | Penn State | Big Ten | 92.350 | 9 | 3 |
| 18 | Appalachian State | Sun Belt | 91.721 | 12 | 2 |
| 19 | Texas | Big 12 | 90.950 | 9 | 4 |
| 20 | Boise State | MWC | 90.950 | 10 | 3 |
| 21 | Missouri | SEC | 88.900 | 8 | 4 |
| 22 | Syracuse | ACC | 87.900 | 9 | 3 |
| 23 | Cincinnati | American | 87.100 | 10 | 2 |
| 24 | Mississippi State | SEC | 87.100 | 8 | 4 |
| 25 | North Carolina State | ACC | 84.650 | 9 | 3 |
| 26 | Texas A&M | SEC | 84.450 | 8 | 4 |
| 27 | Iowa | Big Ten | 83.600 | 8 | 4 |
| 28 | Army | Independent | 83.550 | 10 | 2 |
| 29 | Stanford | Pac 12 | 83.036 | 8 | 4 |
| 30 | Iowa State | Big 12 | 82.900 | 8 | 4 |
Alabama is no debate. My point scale goes to 130 and Alabama was nearly at the top of all my categories. As you can see Oklahoma, in my analysis, is a clear 2nd place. The fight for 3rd and 4th is closer between Clemson, Notre Dame and Ohio State but I think Ohio State suffered terribly for the loss against Purdue and overall just wasn’t a convincing winner of its games. The championship game against Northwestern was a good attempt for making a strong case to get into the final four but it was a tad too late.
My methodology
I had 4 big criteria.
- Win games. Win against whoever you played.
- Win big against strong teams.
- If you lose, lose close against strong teams.
- Win your championship.
Criteria 1: Win games.
This was straightforward. Win percentage. Calculated as games won divided by total games played.
Criteria 2: Win big against strong teams
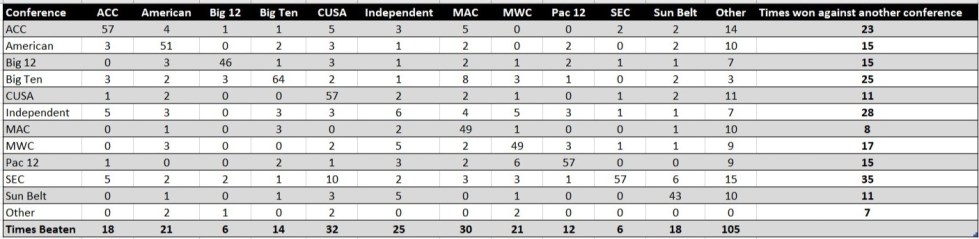
This was a 3-step process. First, I calculated the point margin of victory for each game. This was then multiplied by the strength of the team they won against. Strength of a team is calculated by dividing the total number of games won by the total number of games lost. Third, this was multiplied by the strength of the conference the losing team belonged to. For the calculation of the strength of the conference see further below.
Criteria 3: If you lose, lose close against strong teams
Similar to above, but I reversed it (games lost/games won) * points margin * strength of conference of winning team. This was so that the lower the number the better. Just worked easier for my math.
Criteria 4: Win your championship
Easy enough. Get to the championship and win your game. If you did you got 130 points but multiplied by the strength of the conference.
Strength of Conference


Criteria weights
Each criteria could total 130 points because I ranked each team from 1 to 130 based on their score for the criteria. The the criteria were weighted.
Total Score = (0.15*Win your championship+ 0.45*Win percentage+ 0.25*Win big+ 0.15*Lose close)
All score table

Let the debate begin.
